
Physics of Fluorescence – the Jablonski Diagram
So what is really happening when something fluoresces? Electromagnetic radiation at one wavelength is absorbed and is then re-emitted at a longer wavelength. Wavelengths of light correspond to perceived colors (if they fall in the visible range), and this means that shorter wavelength light like ultraviolet or blue is converted to longer wavelength light, like green, yellow, orange, red.
Before we get too much into the physics, a ‘Quick Start’ summary:
- Photon #1 hits molecule
- Photon #1 absorbed, electron at ground level gains energy and jumps to higher level
- Electron loses some of that energy
- Electron jumps back down to ground level and emits photon #2
- Photon #2 has less energy, corresponding to a different color (wavelength of light)
A Jablonski diagram (below) is typically used to illustrate the physics of fluorescence. In the diagram electronic (energy) states are indicated by bold horizontal lines. The thin horizontal lines above them represent vibrational/rotational sublevels. Electrons are normally at the lowest energy state, indicated by S0. When a photon (indicated by the blue line entering from the left) with appropriate energy interacts with a molecule the photon may be absorbed, causing an electron to jump to one of the levels of an excited state (S1 or S2 in the diagram). By ‘appropriate energy’ we mean an amount corresponding to the energy difference between the ground and excited states. Thus not all incident photons are equally likely to be absorbed. This transition process is very fast, on the order of 10-15 seconds (a millionth of a billionth of a second).
-
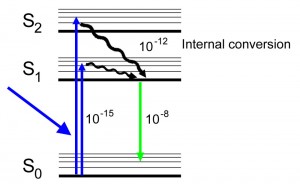
- Jablonski diagram for fluorescence

An excited-state electron rapidly (on the order of 10-12 seconds) loses its energy to vibration (heat), a process called internal conversion, and falls to the lowest level of the first (S1) excited state. From there the electron may fall to one of the sub-levels of the ground (S0) state, emitting a photon with energy equivalent to the energy difference of the transition. This happens on a time scale of nanoseconds (10-9 – 10-8 seconds) after the initial photon was absorbed. Since the emitted photon has less energy than the absorbed photon it is at a longer wavelength. This explains the magical process of fluorescence that converts light of one wavelength (color) to another, and leads to the phenomenal display of highly saturated colors in corals and so many other marine organisms.
The probability that a photon will be absorbed varies with wavelength (energy). Even for those photons that are absorbed there are other processes that compete with fluorescence for de-excitation of the excited-state electrons. In chlorophyll, for example, the energy of excited-state electrons is used to power the chemical engine of photosynthesis, and only a small fraction comes out as the deep red fluorescence we see in plants and algae. The number of photons fluoresced relative to the number absorbed is the quantum efficiency. The higher the absorption and quantum efficiency, the brighter the fluorescence.
Another way to think about this is with the old model of electrons orbiting around the nucleus. In the ground (S0) state the electrons are in the orbital closest to the nucleus. When they absorb the energy of an incoming photon they jump to a higher orbital (S1, S2, etc.) or its sublevels. They can’t jump to the spaces between orbitals, and that is why not all wavelengths of light will make something fluoresce.
The best way to document the fluorescence properties of a particular specimen is to measure excitation and emission spectra. The excitation spectrum is a plot of the relative efficiency of different wavelengths of light to excite fluorescence in the subject, while the emission spectrum is a plot of the relative distribution of energy released in the form of fluorescence.